Paper brief
NovaLAD: A Fast, CPU-Optimized Document Extraction Pipeline for Generative AI and Data Intelligence
NovaLAD splits document parsing into parallel semantic and layout detection, then orders text and gates images before optional vision-model enrichment; its DP-Bench lead is author-reported against historical baseline rows.
The parsing bottleneck before retrieval
A retrieval system cannot recover a table cell that was flattened into the wrong row, or a paragraph that was read across two columns in the wrong order. NovaLAD asks how to extract PDF content into ordered, reusable representations without making a vision-language model (VLM) interpret every page. Its answer is a pipeline: locate what an element is and where it belongs with separate detectors, extract text by the cheapest available route, and reserve optional VLM calls for selected visual content.
That is a useful design argument. The paper also reports strong document-parsing scores, but its benchmark comparison deserves a narrower reading than “faster and better than other parsers.” The question is which stages plausibly improve which measured output—and which have not been isolated experimentally.
Two detectors, two different jobs
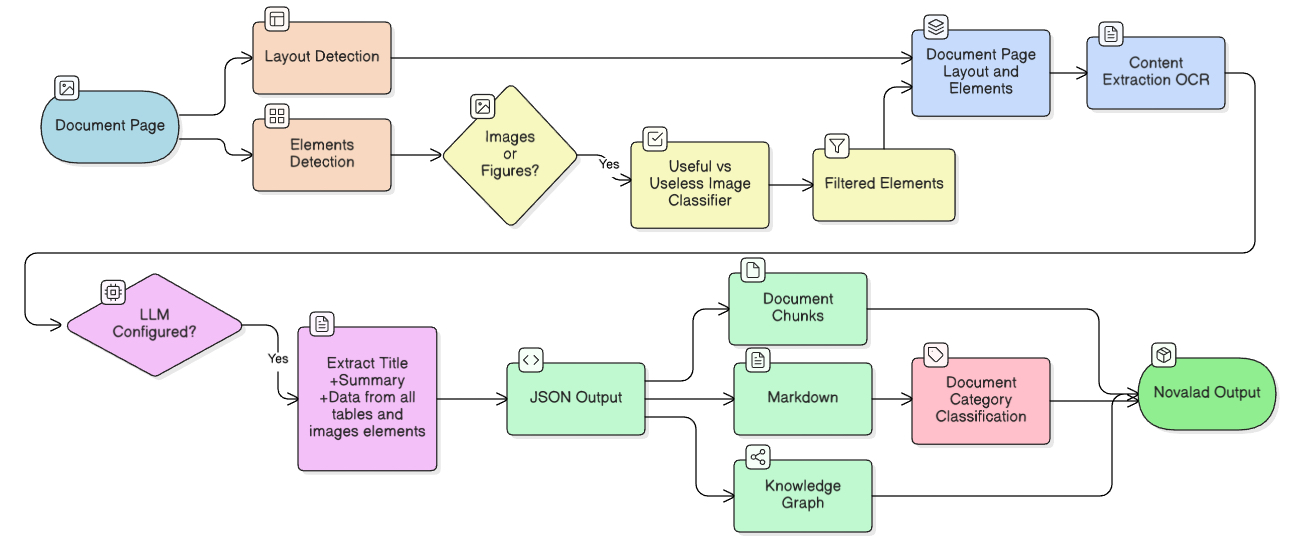
Each PDF page is rendered once at 300 DPI and sent to two YOLOv10 detectors concurrently. The element detector finds content boxes—headings, paragraphs, lists, tables, figures, captions, and headers or footers. The layout detector finds containers such as columns, multi-column regions, and row groups. This is a separation of semantic identity from page topology: a box can be “text,” but the second detector helps decide which column or group it belongs to. Neither detector reads text or infers table cells by itself. The method is detailed in §3 of the versioned paper.
For each layout box, NovaLAD attaches element boxes whose midpoints fall inside it. In multi-column areas, it normalizes horizontal centers, clusters them with DBSCAN, and sorts each cluster vertically; row and generic groups use geometric sorting rules. It then merges grouped and ungrouped blocks into a page-level reading order and applies duplicate and recurring-header/footer corrections. This avoids a separate learned reading-order model, but it makes the output sensitive to missed layout boxes, overlap, midpoint assignment, and the chosen geometric heuristics. Those are failure modes implied by the algorithm, not measured error rates for those cases.
Native text first, selective vision second
After detection, text-like boxes preferentially use the PDF’s native text layer through PyMuPDF. Table and image crops, or text without that layer, go through English EasyOCR. This distinction matters: using embedded text avoids OCR errors on born-digital documents, while scanned pages still need recognition. It does not mean that OCR text alone reconstructs table rows, spans, and cell boundaries.
When image filtering is enabled, detected image/figure crops meet a binary ViT classifier: useful figures can continue; “useless” images are removed from downstream exports as well as optional VLM calls. Tables bypass this image gate. If a VLM is configured, every table and each retained image can receive a title, summary, or structured data; otherwise the pipeline keeps OCR-derived text. The paper does not disclose whether this optional service was enabled in its benchmark run. Image filtering may reduce paid calls, but the paper supplies no gate-on/off cost or accuracy ablation, and a false negative could discard a meaningful figure.
Ordered entities are stored in JSON and used to build Markdown, retrieval-oriented chunks, and a simple document-structure graph. Those exports reuse the same parsing result; they are not separately validated by the paper’s DP-Bench scores. Likewise, CPU-capable local models are not evidence that the reported latency was measured on a disclosed CPU-only machine. Optional hosted VLM enrichment also changes the “offline” and cost story.
A benchmark lead with an old reference frame
In Table 5, the authors report 96.49 TEDS, 98.51 NID, and 8.50 seconds average time for NovaLAD. The paper’s Upstage row reports 93.48 TEDS, 97.02 NID, and 3.79 seconds. NovaLAD’s displayed quality scores are higher, while the Upstage row is faster. The six comparison rows for Upstage, AWS, Microsoft, LlamaParse, Unstructured, and Google match the DP-Bench leaderboard’s October 2024 entries. The manuscript describes “the benchmark leaderboard and our runs” without identifying which rows it reran. These are not established as a simultaneous, matched-hardware head-to-head, and the paper does not compare Docling, MinerU, Marker, or PaddleOCR.
| Parser | TEDS ↑ | NID ↑ | Avg time (s) ↓ |
|---|---|---|---|
| NovaLAD | 96.49 | 98.51 | 8.50 |
| Upstage | 93.48 | 97.02 | 3.79 |
| AWS | 88.05 | 96.71 | 14.47 |
| Microsoft | 87.19 | 87.69 | 4.44 |
| Llamaparse | 74.57 | 92.82 | 4.14 |
| Unstructured | 65.56 | 91.18 | 13.14 |
| 66.13 | 90.86 | 5.85 |
Author-reported NovaLAD result beside historical leaderboard rows; not a same-run or matched-hardware comparison. Higher TEDS/NID is better; lower average time is better. On a narrow screen, scroll the table horizontally.
The scores measure different parts of the flow. In the historical DP-Bench evaluator, NID compares concatenated text in supplied reading order while excluding figures, tables, and charts. That makes the native-text and ordering paths relevant, but it does not directly test image understanding, boxes, knowledge-graph usefulness, or answers from a retrieval system. TEDS compares HTML table trees, including structure and cell content; TEDS-S is structure-only. In this historical evaluator, table scores are averaged over documents with reference tables, using the first HTML table tree in each; a missing prediction scores zero. A table detector plus OCR text is not an HTML table tree. The paper describes category mapping and optional VLM-produced rows but does not specify the exact conversion into the benchmark’s required content.html, or give a VLM-off table score. Its Table 5 omits NovaLAD’s TEDS-S despite mentioning that metric. See the versioned layout evaluator and table evaluator.
This distinction prevents a tempting but unsupported causal story. The image gate cannot by itself explain a higher NID, because figures are excluded; tables bypass that gate. Geometric ordering is a plausible contributor to NID, and visual table interpretation might affect TEDS, but there is no component ablation showing how much each contributes. The detector validation results measure different tasks: the paper reports layout-detector mAP50 of 0.567 and element-detector mAP50 of 0.859 on their own training evaluations, not DP-Bench end-to-end accuracy. Nor are prediction JSON, per-document results, machine specifications, exact service settings, or confidence intervals supplied to reproduce the Table 5 comparison. This is a reproducibility limit, not evidence the reported scores are false.
The flow comparison worth running
The interesting comparison is where each parser spends its work. NovaLAD spends local computation on two detectors, geometric grouping, native-text extraction, and OCR; it may spend external VLM calls on tables and images selected by the classifier. The benchmark’s vendor rows are configured products, not disclosed algorithms with identical internal stages. Their older scores cannot show that NovaLAD’s particular scheduling or gate causes the quality difference. The selected ViT is reported at 98.53% image-classification accuracy, while another configuration in the paper’s Table 3 reports 99.35%; without matched operating cost and end-to-end ablations, “best classifier” is not a simple accuracy conclusion.
A decisive follow-up would freeze the same DP-Bench revision and documents, release predicted JSON and the table-HTML adapter, and run the alternatives under disclosed settings. Then remove one NovaLAD choice at a time: the second detector, geometric grouping, native-text preference, image gate, and optional VLM. Report NID, TEDS, TEDS-S, missed tables, image-filter false negatives, latency distribution, and any API spending separately. This is a proposed test, not an experiment the paper reports.
The paper-mentioned repository describes a client for a hosted API rather than verified public detector weights, grouping code, or benchmark predictions. That limits independent reconstruction of the CPU pipeline from the available project artifact.
What to carry forward
- Separate content recognition from layout topology; explicitly test whether the extra structural detector fixes real multi-column reading errors.
- Prefer native PDF text when present, but evaluate scanned pages and table structure separately from general text order.
- Treat image filtering as a quality–cost trade-off: measure false negatives and actual avoided VLM calls rather than assuming a classifier score establishes savings.
- Compare parser quality and speed on the same benchmark revision, settings, and hardware. A higher TEDS/NID row beside an older leaderboard entry is a lead to investigate, not a controlled explanation.
- Keep RAG chunks and document graphs distinct from DP-Bench extraction metrics; downstream answer quality needs its own test.
Links
- NovaLAD on arXiv (version 1)
- Versioned paper HTML
- Versioned PDF
- DP-Bench historical leaderboard and dataset card
- DP-Bench historical evaluation scripts
- NovaLAD paper-mentioned API-client repository (submission-time-adjacent snapshot; not verified evaluation code)
- Manuscript and Figure 1 reuse license: CC BY 4.0